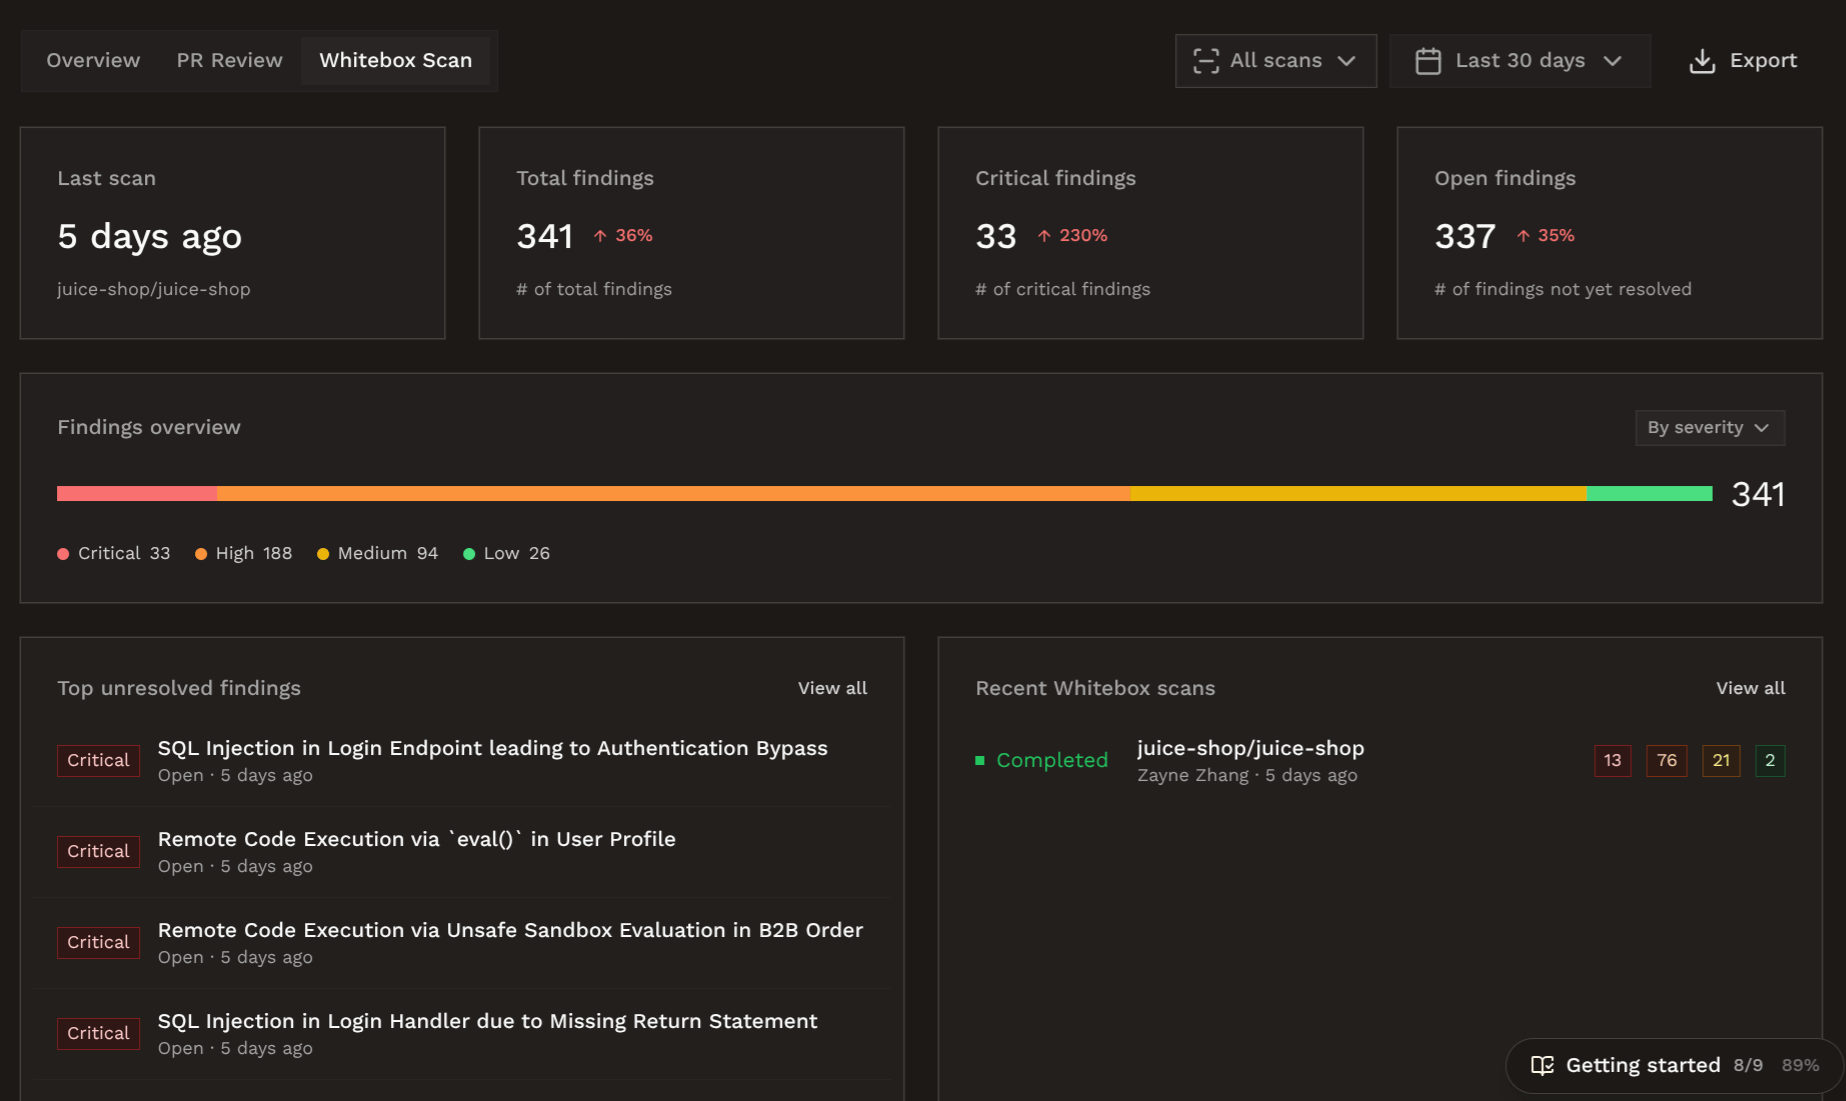
- Overview
- PR Review
- Whitebox Scan
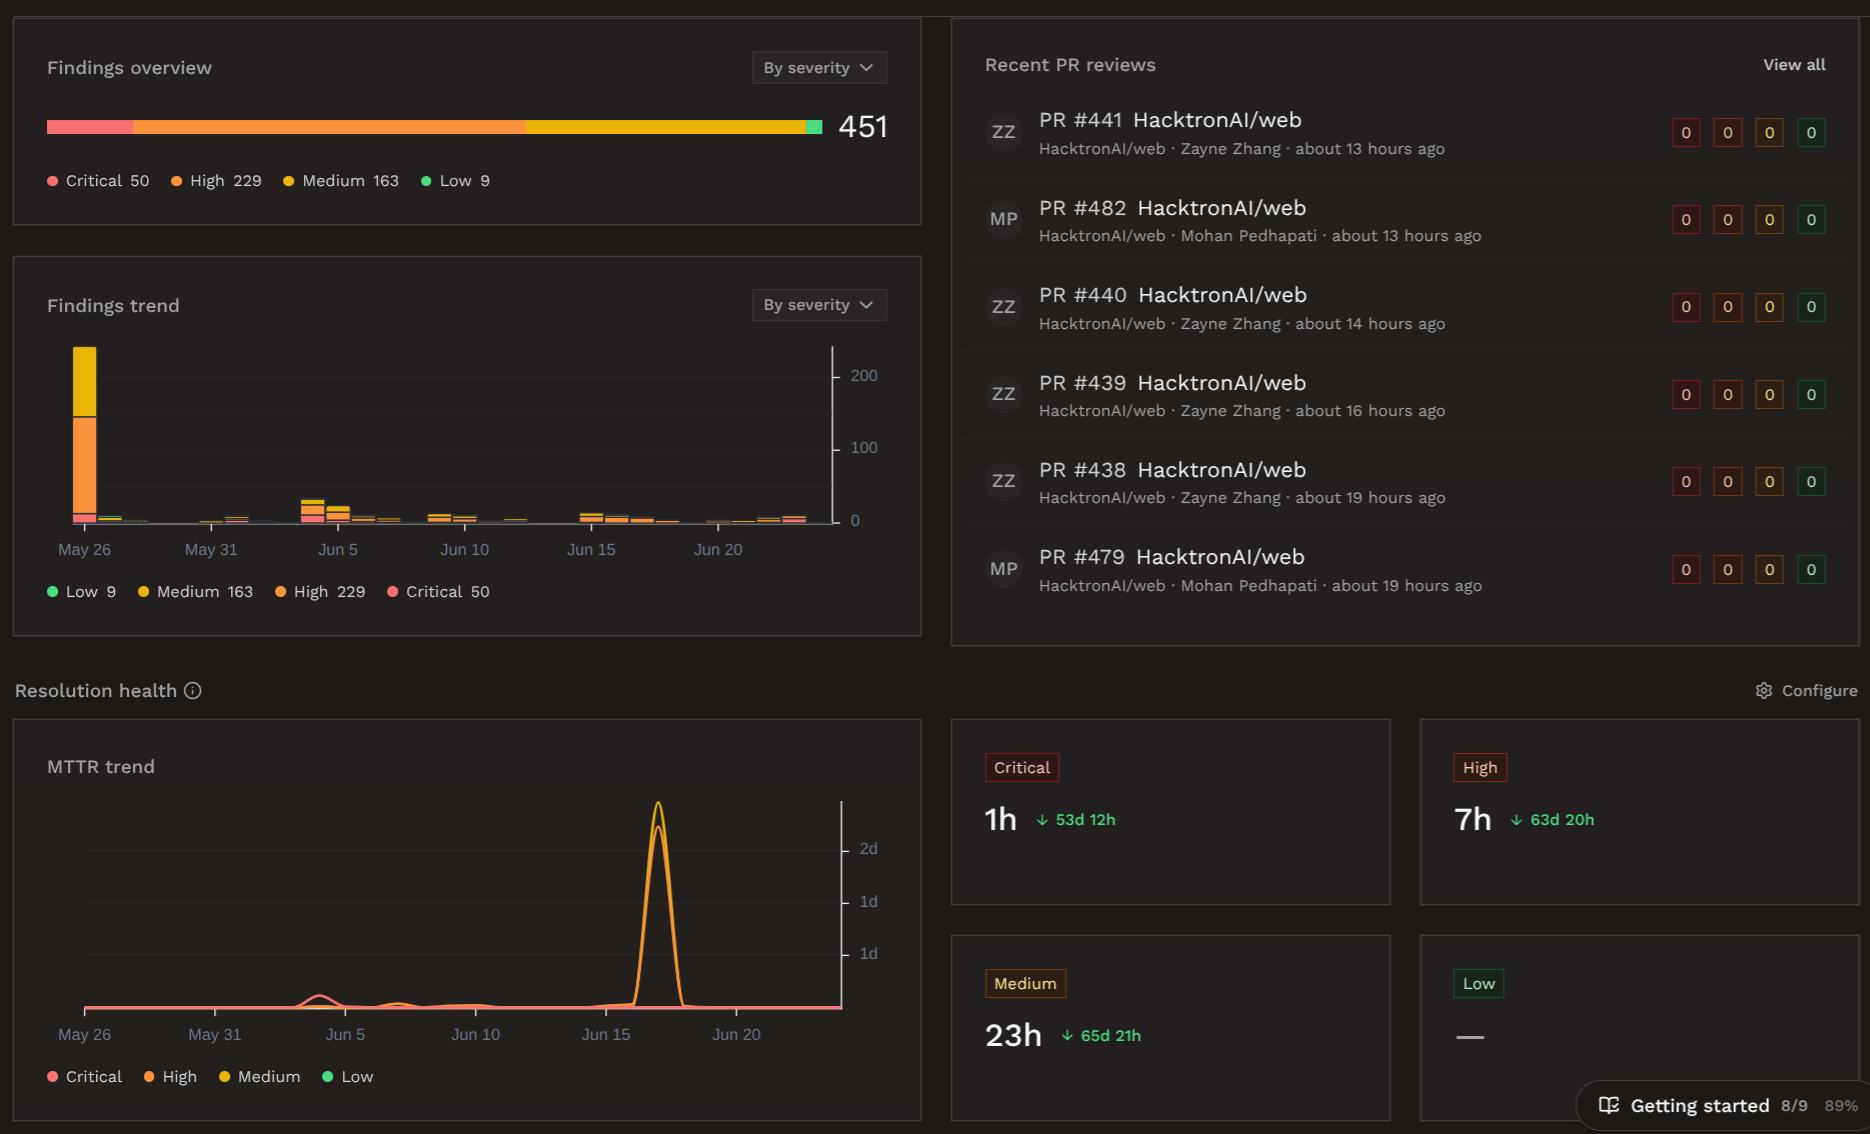
Usage Overview
View statistics like scan volume, finding counts, and repository coverage at a glance.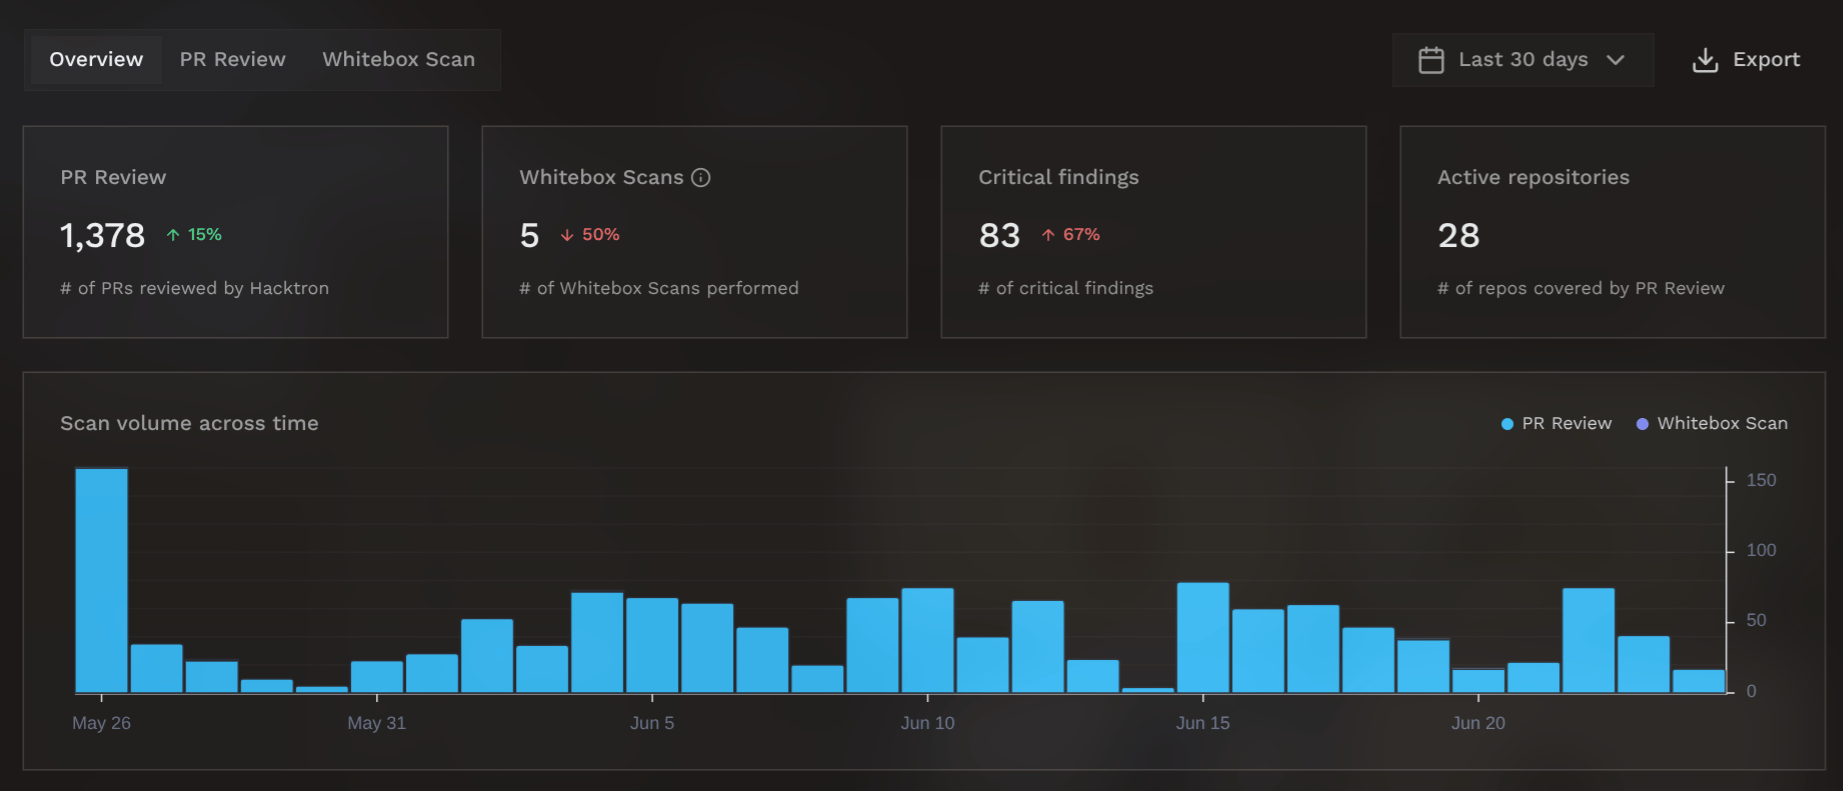
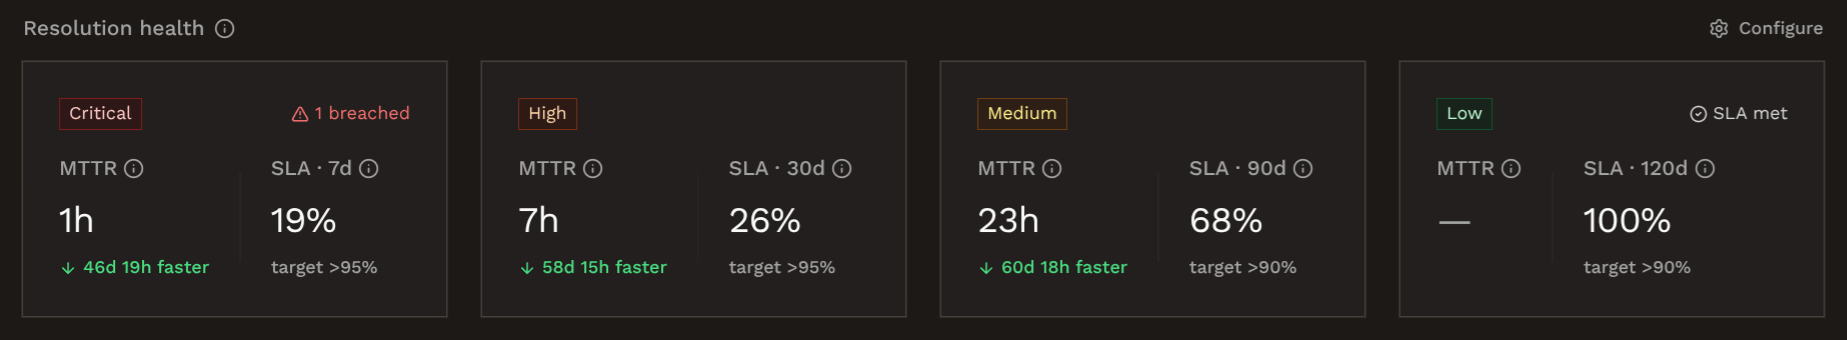
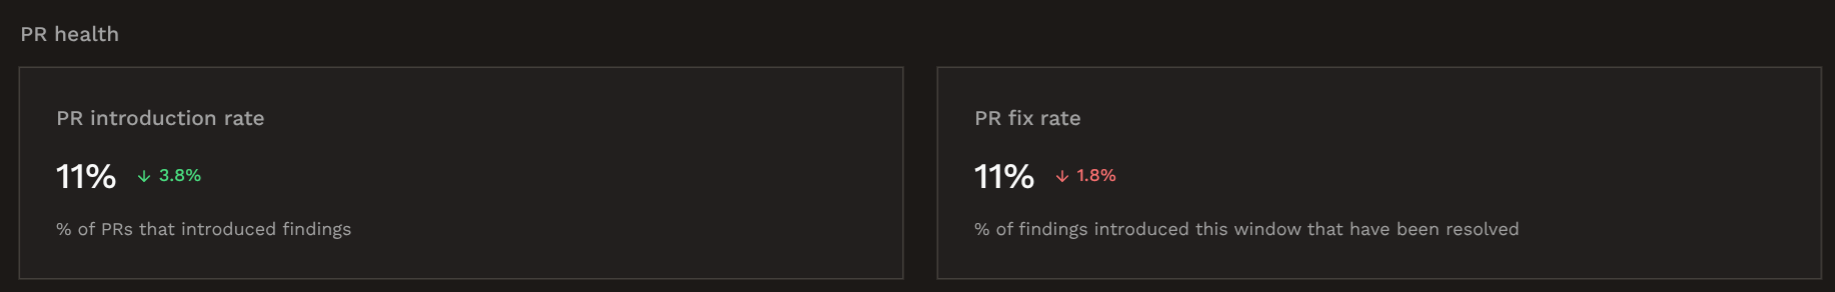
Resolution Health
From the settings page, you can configure SLA tresholds for remediating findings of different severities.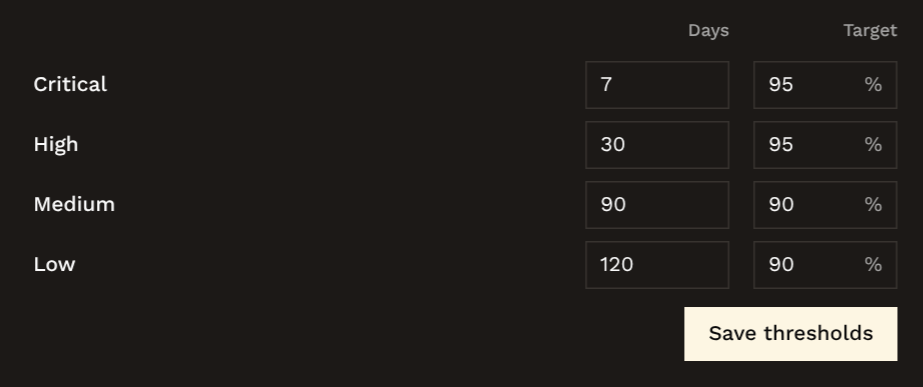
Check gate
From the settings page, you can also set an org-wide Severity threshold.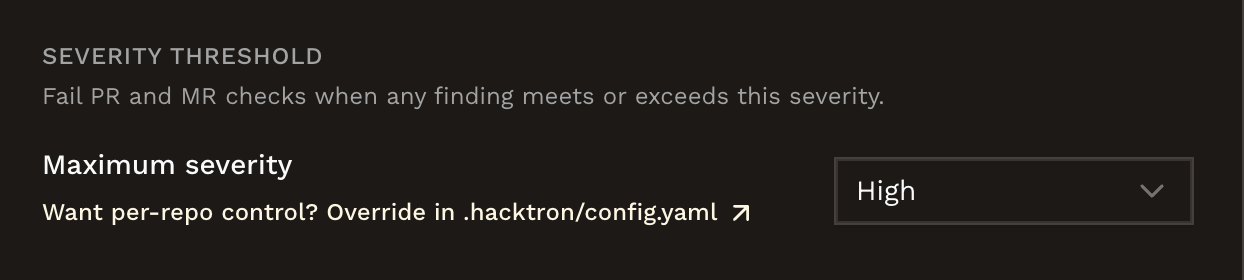
Next steps
Findings and feedback
See where findings are posted and how triage improves reviews.
Integrations
Connect your project management, communication, and other tools to Hacktron.