> ## Documentation Index
> Fetch the complete documentation index at: https://docs.hacktron.ai/llms.txt
> Use this file to discover all available pages before exploring further.
# Dashboard
> Track Code Review and Whitebox scan activity across your organization from the Hacktron dashboard.
The dashboard is split into three tabs, so you can view the metrics that matter. In the top right corner
of each tab, you can configure the time period of the data displayed, and download the data as a PDF report
by clicking on **Export**.
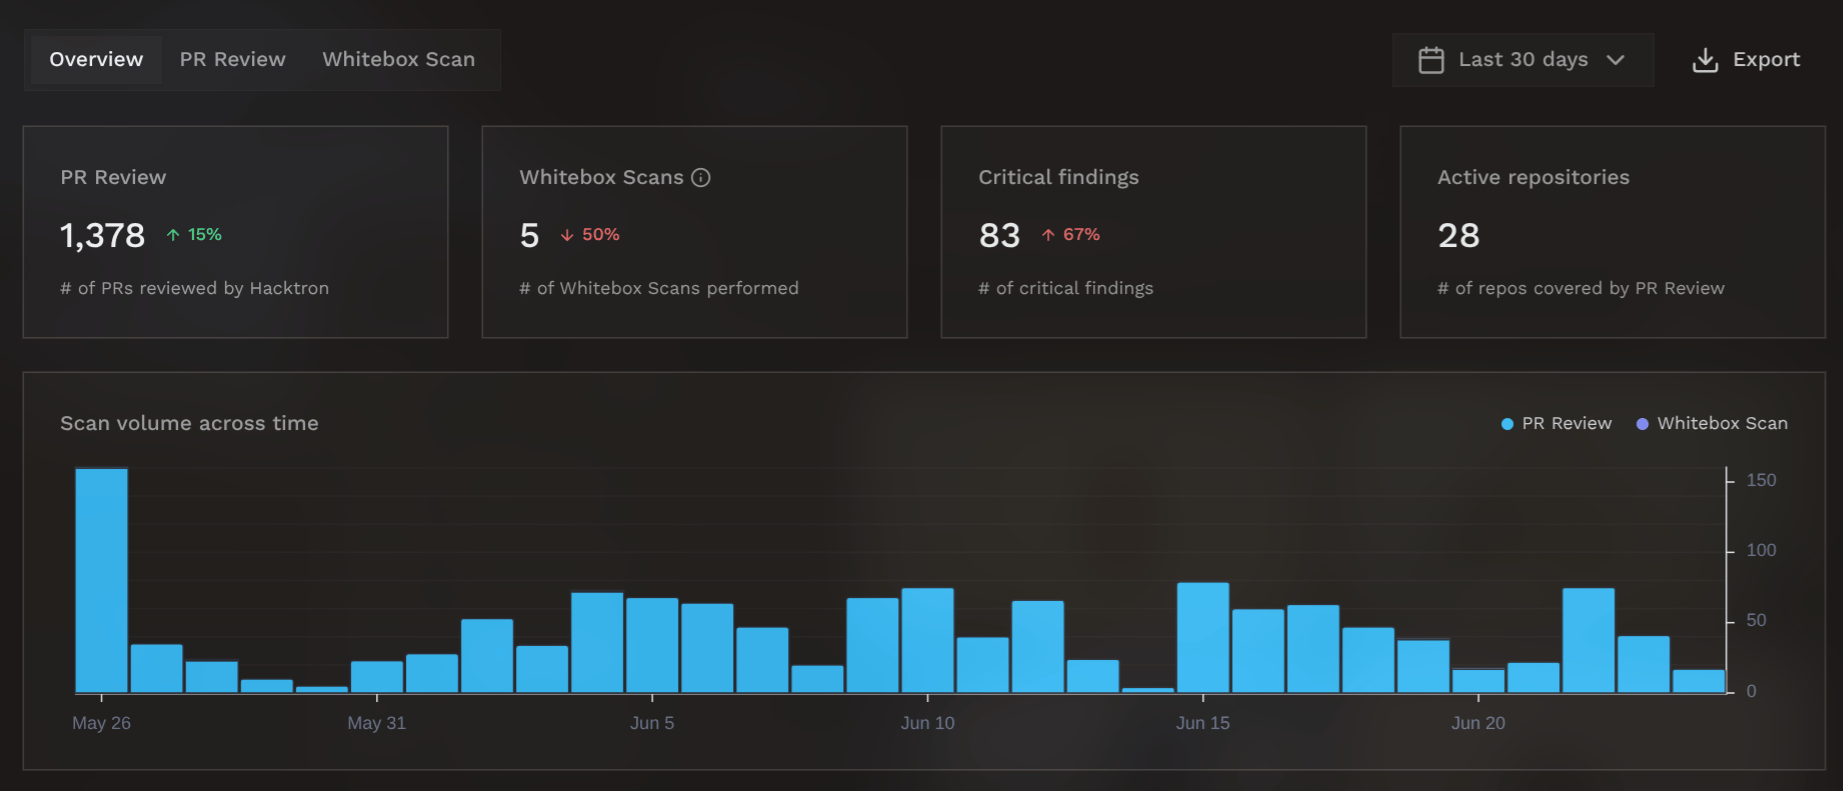
## Usage Overview
View statistics like scan volume, finding counts, and repository coverage at a glance.
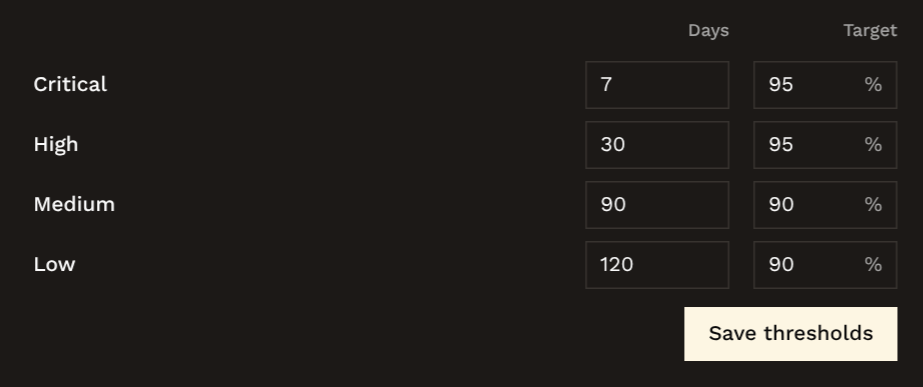
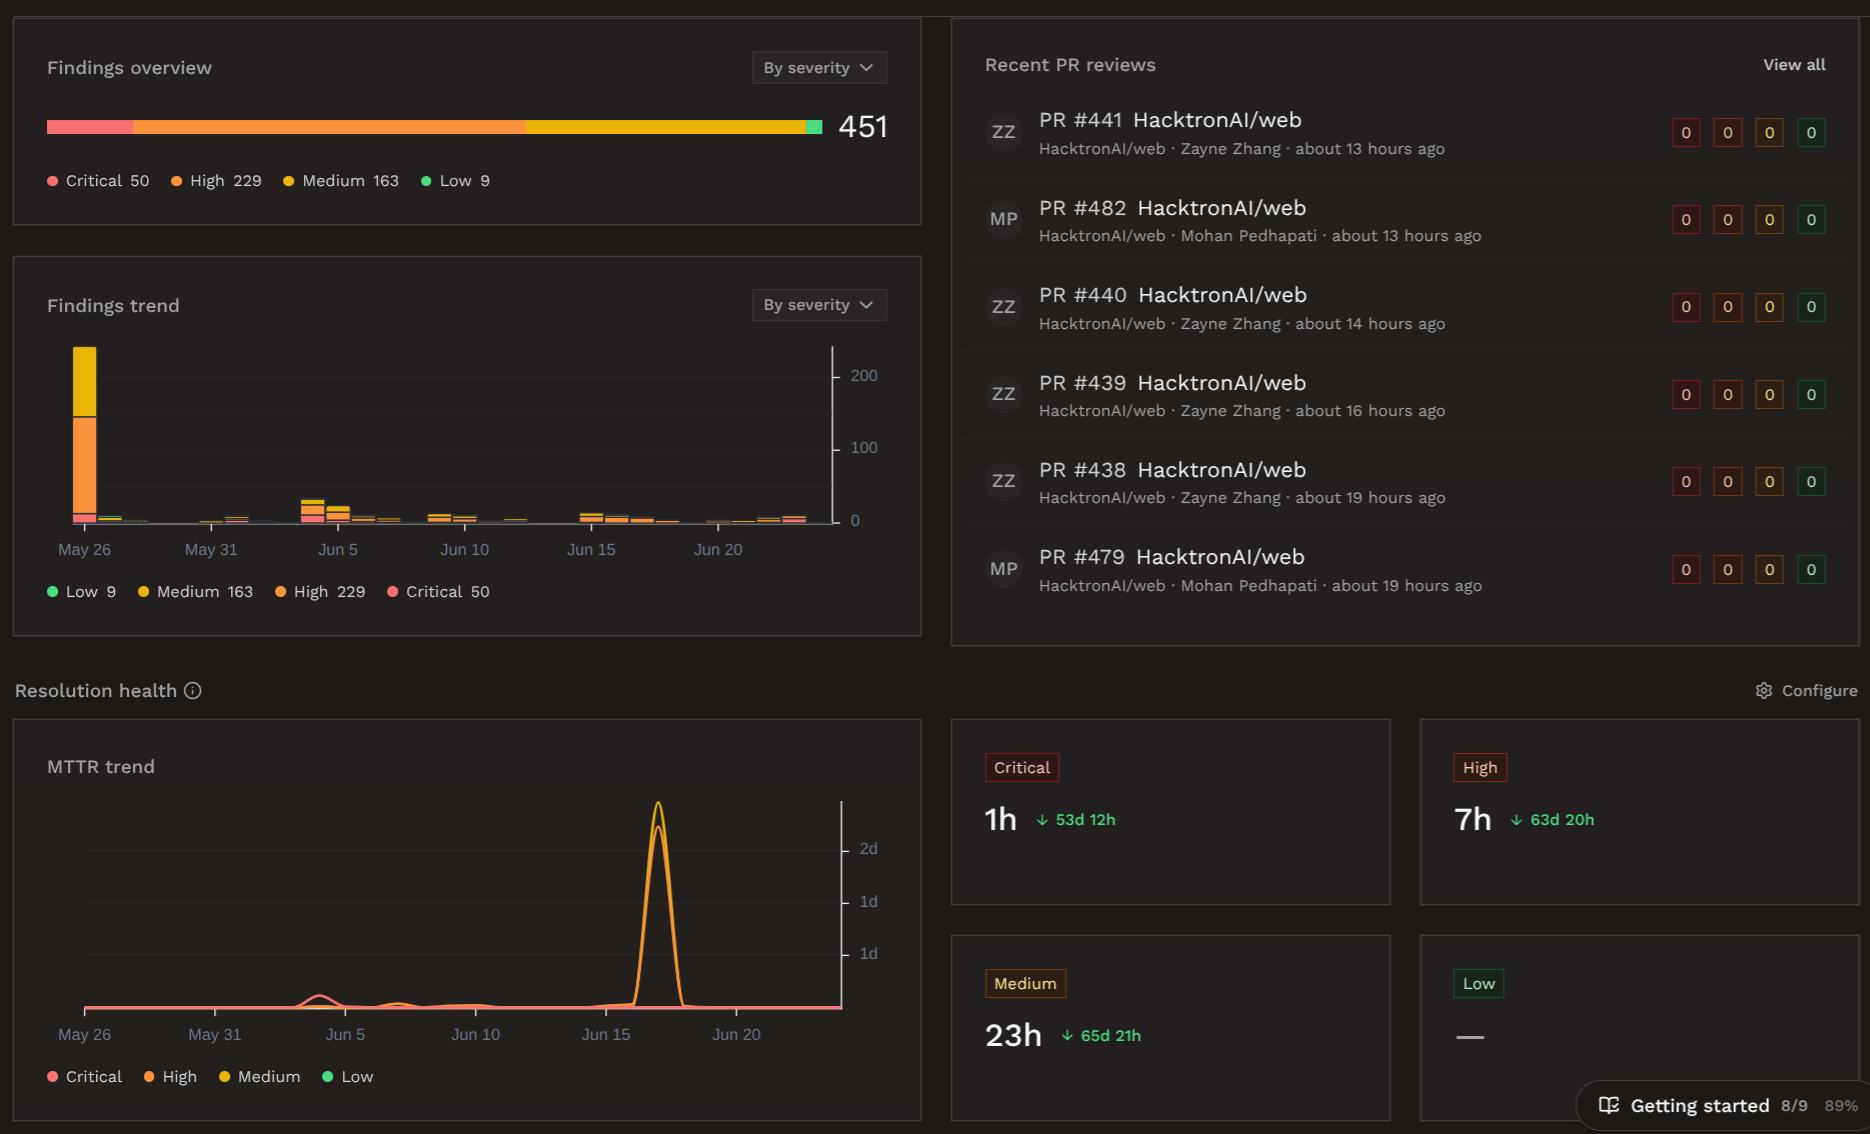
 ## Resolution Health
From the settings page, you can configure SLA tresholds for remediating findings of different severities.
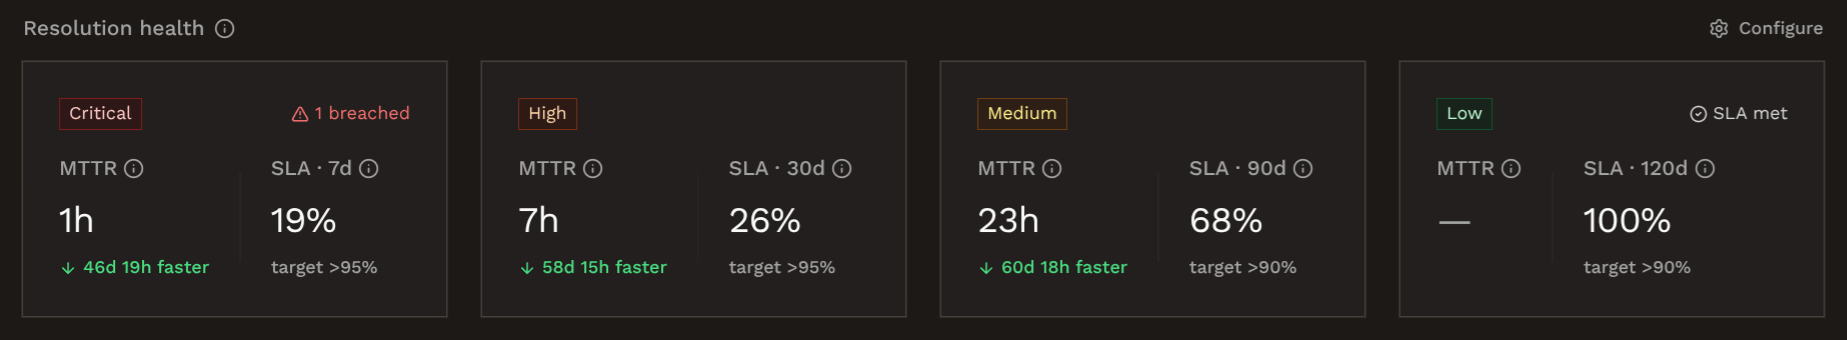
## Resolution Health
From the settings page, you can configure SLA tresholds for remediating findings of different severities.
 This is used to track your resolution health. Hacktron calculates your Mean Time to Resolution (MTTR),
and the percentage of findings that are resolved within the SLA tresholds.
This is used to track your resolution health. Hacktron calculates your Mean Time to Resolution (MTTR),
and the percentage of findings that are resolved within the SLA tresholds.
 ## Check gate
From the settings page, you can also set an org-wide **Severity threshold**.
## Check gate
From the settings page, you can also set an org-wide **Severity threshold**.
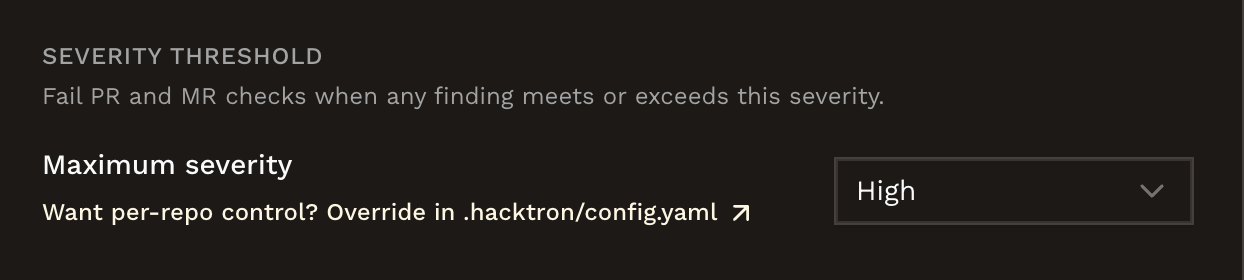 See [Fail the check on findings](/code-review/config#fail-the-check-on-findings) for details and per-repository overrides.
## PR Health
View the percentage of pull requests that introduced new security issues, and the percentage of issues that have been resolved.
See [Fail the check on findings](/code-review/config#fail-the-check-on-findings) for details and per-repository overrides.
## PR Health
View the percentage of pull requests that introduced new security issues, and the percentage of issues that have been resolved.
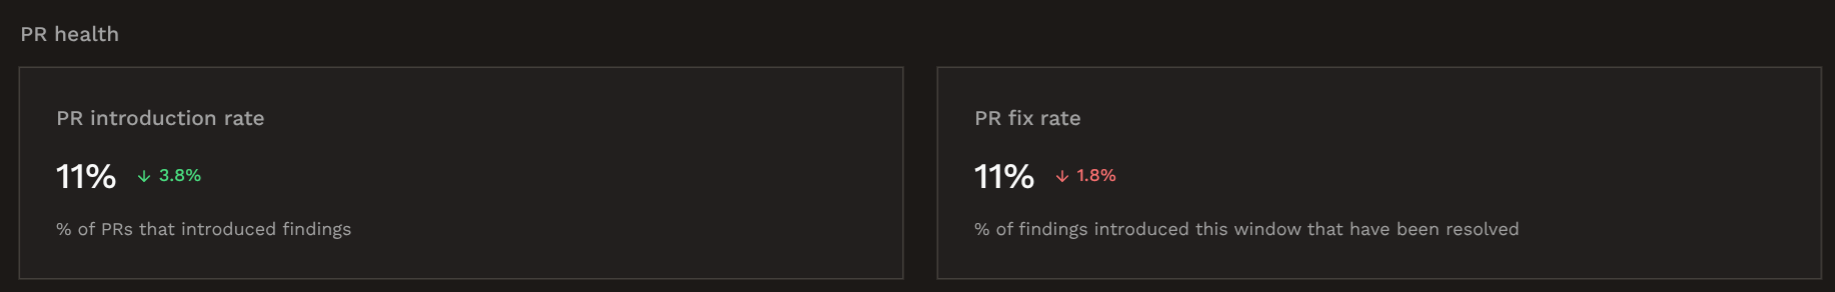 Hacktron also tracks the number of new security issues of varying severities over time, the Mean Time to Resolution (MTTR),
and the percentage of issues that are resolved within the SLA tresholds.
Hacktron also tracks the number of new security issues of varying severities over time, the Mean Time to Resolution (MTTR),
and the percentage of issues that are resolved within the SLA tresholds.
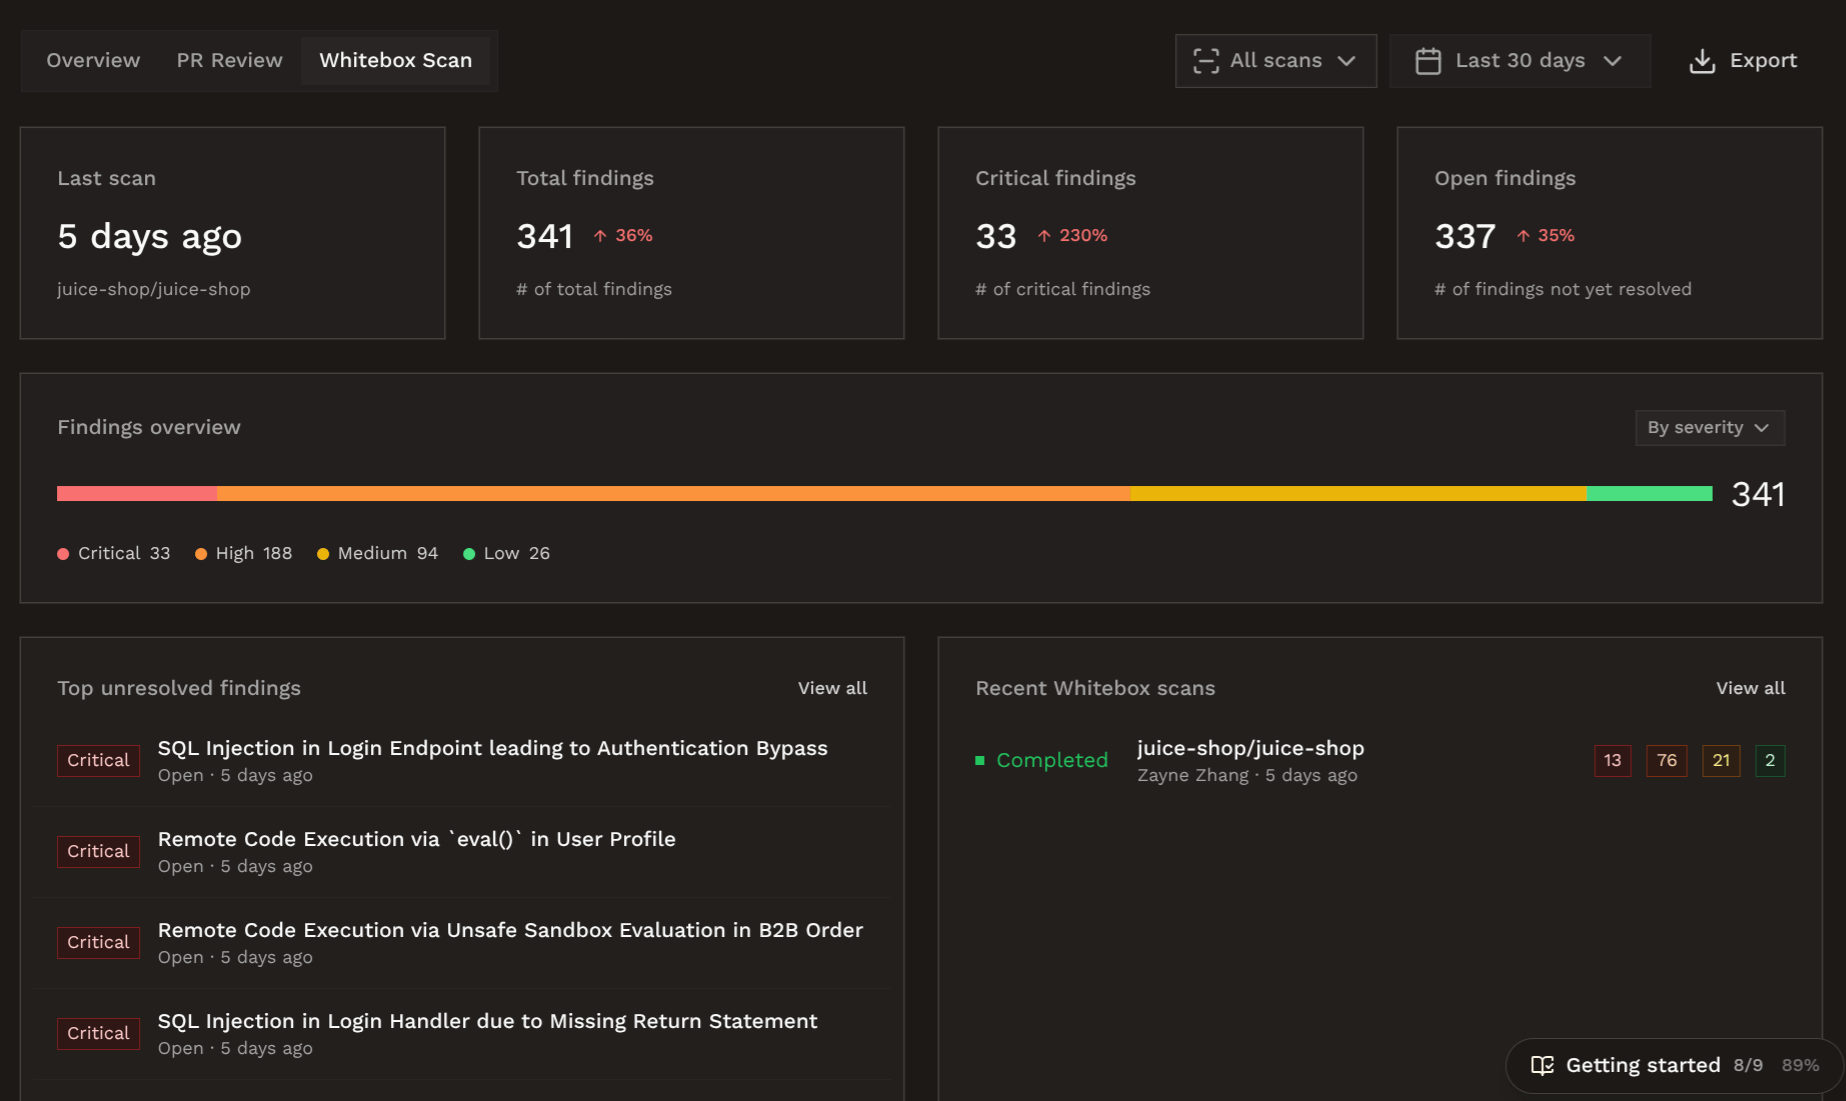
 View the breakdown of findings from whitebox pentests, and the top unresolved findings that you should take action on.
 ## Next steps
See where findings are posted and how triage improves reviews.
Connect your project management, communication, and other tools to Hacktron.
## Next steps
See where findings are posted and how triage improves reviews.
Connect your project management, communication, and other tools to Hacktron.